|
|
Order by Related
- New Release
- Rate
Results in Title For charting
 | IT Locus Charting is an advanced charting application for graphical analysis of financial and stock market. It supports any number of windows with an arbitrary number of charts of stocks, futures, mutual funds or indices in each of them. .. |
|
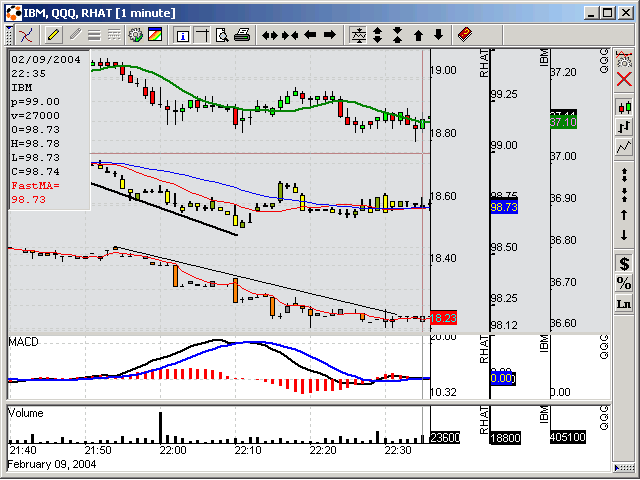
 | Our EOD charting program is an outstanding charting application that is ideal for beginning traders. It will work seamlessly with the DataSharks End of Day Downloader, as well as their Real Time Downloader. Additionally it works with other data downloader's such as: DialData, CSI, Bridge - any 'end of day' data that is stored either in ASCII or MetaStock format. The ability to plot real time data (obtained by the DataSharks RT Downloader) is included in the Epsilon Charting application for no additional fee. The Epsilon EOD charting application is the only charting application that has the ability to read the FREE REAL TIME prices that are available on the Internet - we know of no other charting application, which will accomplish this! The charting application is very easy to use with the strength of a professional charting application serving as its foundation. We offer a free trial period of three weeks that will provide you ample enough time to prove to yourself how easy to use, agile, and powerful the charting application is. The program comes with detailed step by step instructions that will have you viewing charts like a seasoned pro in no time at all! As everyone knows viewing the data is only possible if the data has been saved on ones hard disk. You will be pleased to know that our charting application can read all of the more common data formats such as: ASCII (text), CSV (spreadsheet), CSI, CompuTrac/MetaStock format files, CRB Charts, TC 2000, Knight-Ridder Pro. ..
|
|
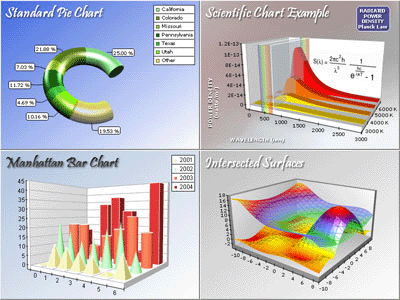
| The 3D Charting Toolkit is a component bundle designed to help you to display 2D and 3D business, scientific and presentation charts. The package includes 3DChart, 3DPieChart, 3DClock, 3DLegend and 3DClock all sharing a set of common features. The main component is 3DChart. Following are the key feature of this powerful component:
.. |
|
 | Financial Charting Component is powerful charting compoent and is designed for stock charting specifically. It has strikng visual effects, great interactivity, zoom and pan functions. It is built with other most frequently used graphic shapes. ..
|
|
 | Easy to use .NET gauge and charting controls for Windows Forms applications. The package includes Graph, Line, Area, Bar, Radar and Pie charts and Oval and Linear gauges. Each of them can be fully customized via the hundreds properties and methods. .. |
|
 | Easy to use .NET gauge and charting controls for Windows Forms applications. The package includes Graph, Line, Area, Bar, Radar and Pie charts and Oval and Linear gauges. Each of them can be fully customized via the hundreds properties and methods. ..
|
|
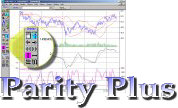 | Parity Plus is one of the most powerful Stock Charting and Technical Analysis Programs available on the market. Parity includes over 50 of the most popular indicators for the technical analysis of stocks and commodities .. |
|
Results in Keywords For charting
| IT Locus Charting is an advanced charting application for graphical analysis of financial and stock market. It supports any number of windows with an arbitrary number of charts of stocks, futures, mutual funds or indices in each of them... |
|
 | ZoomChart - the interactive charting tool for your website
ZoomChart is a powerful Java applet for charting data on the internet. Simply integrate your data with our plug and play software for charting content in minutes. Plot unlimited lines of historical or real time data and customise the chart look and feel with simple html changes. Website users can select and deselect lines and zoom in and out of data interactively. Free eval download and unique online service providing free hosting of slimline ZoomChart edition...
|
|
| NetCharts brings you a suite of Java applets for HTML authors, Web developers, and Java programmers to quickly create highly flexible on-line charts without programming.NetCharts easy-to-use, highly interactive Java applets provide 14 flexible, robust chart types and superior client-side interactivity with drill-down, scroll & zoom, rotation. NetCharts gets you charting in minutes, and requires no specialized programming skills, though these classes may be incorporated easily into web applications. Version 4.0 uses Java 1.2, and takes advantage of JVM 1.3 advanced drawing features! Installation packages provided for Windows, Linux, and Solaris.We also field our NetCharts charting engine as NetCharts Server (for the corporate enterprise; and NetCharts (Java) Beans and NetCharts Enterprise Java Beans for Web developers. Additionally, ChartWorks Designer is the authoring tool that works with all our charting products. Documentation and basic phone/email support are included, as well as hundreds of examples and templates are available on our web site, and with the free, fully-functional 25-day evaluation download.Download:http://www.visualmining.com/products/register.htmlFor more information, start here:http://www.visualmining.com/products/netcharts.html .. |
|
| Our EOD charting program is an outstanding charting application that is ideal for beginning traders. It will work seamlessly with the DataSharks End of Day Downloader, as well as their Real Time Downloader. Additionally it works with other data downloader's such as: DialData, CSI, Bridge - any 'end of day' data that is stored either in ASCII or MetaStock format. The ability to plot real time data (obtained by the DataSharks RT Downloader) is included in the Epsilon Charting application for no additional fee. The Epsilon EOD charting application is the only charting application that has the ability to read the FREE REAL TIME prices that are available on the Internet - we know of no other charting application, which will accomplish this! The charting application is very easy to use with the strength of a professional charting application serving as its foundation. We offer a free trial period of three weeks that will provide you ample enough time to prove to yourself how easy to use, agile, and powerful the charting application is. The program comes with detailed step by step instructions that will have you viewing charts like a seasoned pro in no time at all! As everyone knows viewing the data is only possible if the data has been saved on ones hard disk. You will be pleased to know that our charting application can read all of the more common data formats such as: ASCII (text), CSV (spreadsheet), CSI, CompuTrac/MetaStock format files, CRB Charts, TC 2000, Knight-Ridder Pro...
|
|
 | Stock charting and technical analysis trading system with a complete set of models and charting features, support for all instruments, Internet connectivity, spreadsheet-like capabilities, built-in database query builder and fully customisable charts.. |
|
| Financial Charting Component is powerful charting compoent and is designed for stock charting specifically. It has strikng visual effects, great interactivity, zoom and pan functions. It is built with other most frequently used graphic shapes...
|
|
| Easy to use .NET gauge and charting controls for Windows Forms applications. The package includes Graph, Line, Area, Bar, Radar and Pie charts and Oval and Linear gauges. Each of them can be fully customized via the hundreds properties and methods... |
|
| Easy to use .NET gauge and charting controls for Windows Forms applications. The package includes Graph, Line, Area, Bar, Radar and Pie charts and Oval and Linear gauges. Each of them can be fully customized via the hundreds properties and methods... |
|
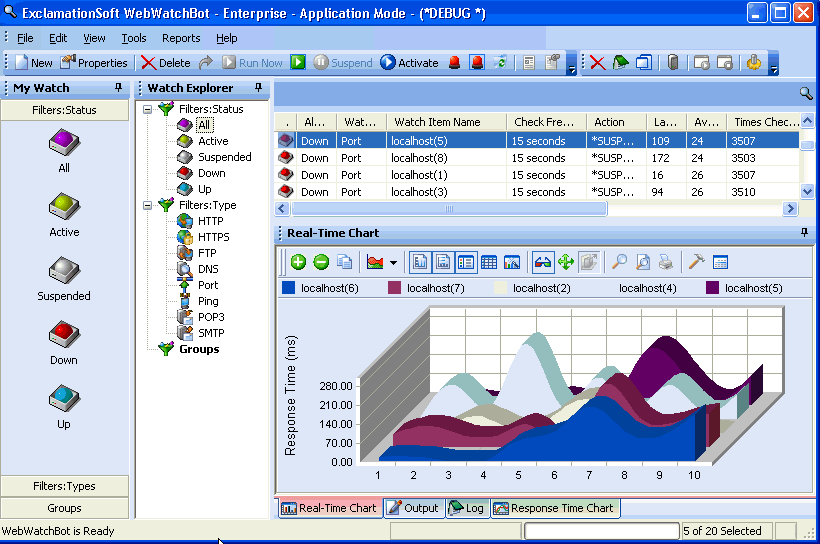 | Monitoring and Analysis Software for Web Sites and IP Devices. Maximize availability through accurate, in-depth monitoring and alerting functionality. Analyze historical data for trends and visualize current state with real-time charting and graphs.
8 different monitoring types: Ping, HTTP, HTTPS, SMTP, POP3, FTP, Port, and DNS. View updated statistics on your watch items in real-time. Easily manage hundreds of watch items by grouping one or more watch items or view watch items based on status, watch type. Modify multiple watch items, using any existing watch item as a template. Copy existing watch items and import/export all watch items for backup or portability to another computer running WebWatchbot.
View last watch item output - continually updated. View log file in real-time. WebWatchBot can be run as a Windows Service or Application.
Real-Time Charting of one or more watch item response time. Perform trend analysis of historical data based on time of day, day of week or day of month and more. Customize look and feel of GUI interface
Copy-and-paste chart as a metafile, bitmap, or data points to most Windows applications, e.g. Microsoft Word, Microsoft Excel, Notepad, etc. Chart printing. Chart zooming. Increase or decrease the number of charting points on the fly. Customize look-and-feel of the chart - colors, type, and 2D/3D. Also includes, built-in reporting of historical data which can be easily scheduled through a command line interface and the Window Scheduler.
Effective alerts allow you to decide when to be notified and why. Receive notification via email alerts, a small text messages to an email enabled device, on-screen display, audible alert, or run an external program... |
|
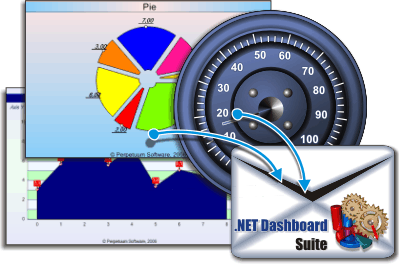 | SharpShooter Dashboards is a pack of .NET components for complicated and intelligent digital dashboard creation. The package includes the component for hardware emulator creation and the component for interactive graphs and charts creation... |
|
Results in Description For charting
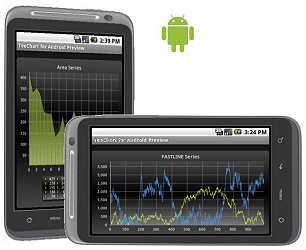 | Charting library for Android platform, written in native Android Java and supports most teechart series types including pie chart, line chart, points, area, bar, gauges and maps and 2D, 3D formats.The Charting library includes 100% native Java code... |
|
 | Chart Component .NET is a powerful charting component used to create attractive 3D and 2D charts for desktop applications and web pages using .NET technologies. 3D charting uses the OpenGL graphics engine to create sophisticated 3D charts and graphs...
|
|
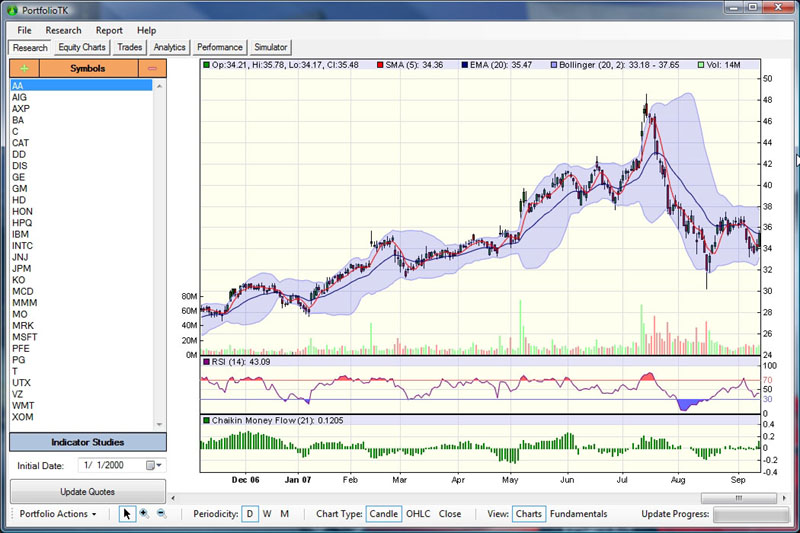 | PortfolioTK is a stock portfolio manager that provides both accurate quantitative statistics and advanced charting. It includes overall portfolio equity curve performance with risk analysis, trade log entry supporting partial position matching of both long and short trades, and a charting database with over 35+ technical indicators. Not only that but you can use PortfolioTK's reporting features to see how your portfolio has been performing against the major benchmark indices... |
|
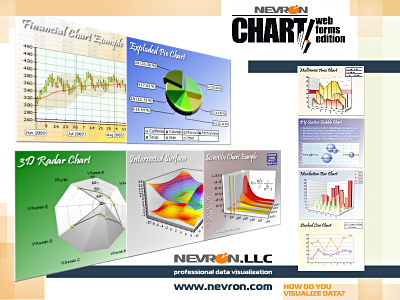 | Nevron Chart for Web Forms is the leading charting component for ASP .NET applications. The component delivers rich charting functionality suitable for presentation, scientific, financial and business charts. This combined with the presentation "out of the box" quality of the generated charts and the powerful ASP .NET support makes this component unique.
New features in 3.0:
New GDI+ rendering engine a..
|
|
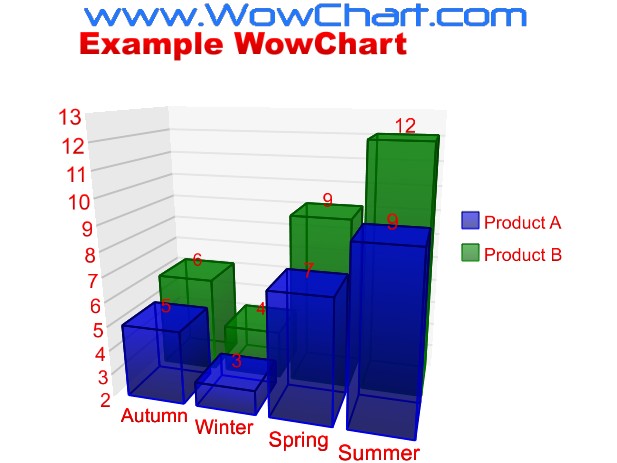 | Get some of the newest idea in charting. WowChart is the quick way to get spectacular 3D animated bar charts in PowerPoint or Excel. WowChart makes producing awesome charts as simple as a single toolbar button click. WowChart let's you visualize your data in the clearest and most professional way, ensuring your audience sit up and notice the data you are presenting. You can display a spectacular animated 3D graph, or display a still image that is printable. Get some WowChart wow factor. Try out the most advanced charting technology available today... |
|
 | The 3DChart component is a powerful charting tool using the OpenGL 3D engine to display 2D and 3D business, scientific and presentation charts. It supports all basic charting types with lots of different style and logic variations. All chart type combinations can be simultaneously displayed. 3DChart has four vertical axes plus one category and serie axis. It has an integrated legend. The data can be extracted from an ADO data source. Fill Effects and materials can be applied on all chart elements including individual data points and texts. The component is COM and .NET compatible. The key features of the component are: ..
|
|
| A marching band drill design charting system. Create simple to complex designs with powerful graphic charting tools including point, line, block, parallelogram, arc, circle, and freeform bezier curves. Select from various symbols and colors to represent your winds, drumline, orcolor guard positions. Edit tools include move, copy, delete, mirror, scale, rotate, and join. True Perspective viewing mode displays your drills from the press box or visitors side using selectable heights and distances. Printwith options to select paper size, orientation, grid spacing, hash marks, and .. |
|
| A contour charting program that has been built through our extensive pursuit of how 3D numeric data can be most effectively processed and converted into a graph. WscntE features a unique functionality; graphics data are divided into three elements: formatting, numeric, and comment data. This feature enables you to translate numeric data into a chart quickly and easily by simply specifying formatting data. Traditional charting software can be compared to a custom made suit that requires a lot of time and labor to be finally completed. On the other hand, WscntE provides a user with an easy way to create a desired graph much as he selects the suit which best fits from a variety of ready-made suits. .. |
|
| The Inverline.com free Web Service is a Charting Windows application that connects to Inverline.com web site and retrieves updated historical stock quotes from over 2500 stocks.With Inverline.com you can display technical analysis charts, configure multiple financial indicators, draw trend lines and more... Stock quotes are updated daily at the end of the markets.Visit Inverline.com web site to register free, get access to save your configurations and additional financial features.Inverline has been developed using the award-winning TeeChart Pro charting components and it is currently being licensed in several spanish Banks, Broker agencies, Web magazines and Stock Exchanges. .. |
|
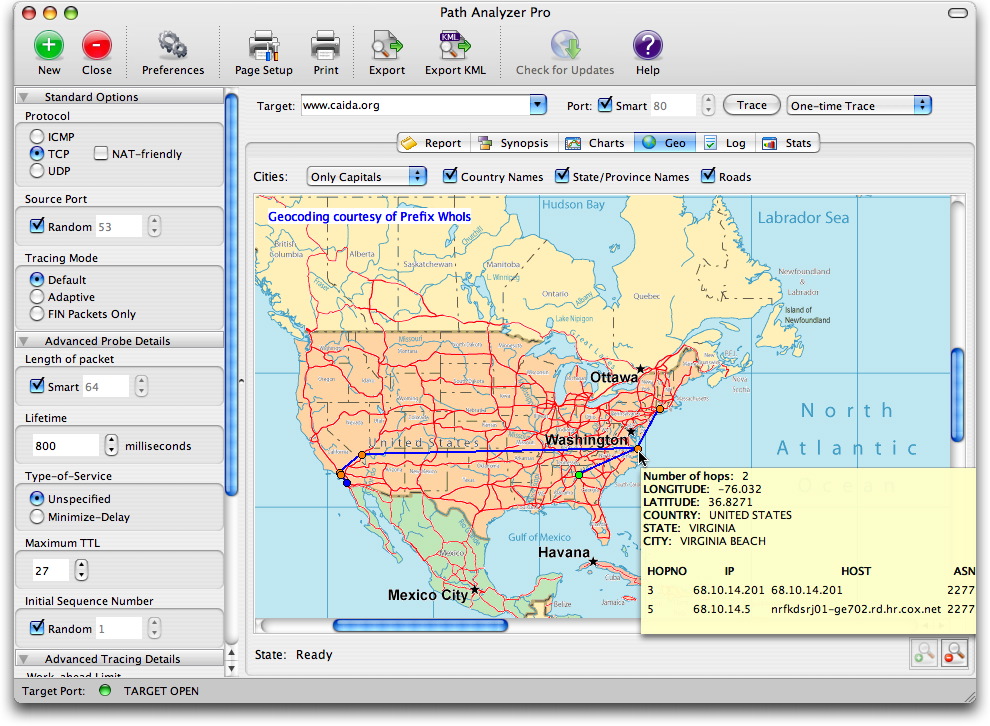 | Advanced graphical traceroute with charting, ip location maps, whois, performance testing, firewall detection, and much more.. |
|
Results in Tags For charting
| Financial Charting Component is powerful charting compoent and is designed for stock charting specifically. It has strikng visual effects, great interactivity, zoom and pan functions. It is built with other most frequently used graphic shapes... |
|
| IT Locus Charting is an advanced charting application for graphical analysis of financial and stock market. It supports any number of windows with an arbitrary number of charts of stocks, futures, mutual funds or indices in each of them...
|
|
| Our EOD charting program is an outstanding charting application that is ideal for beginning traders. It will work seamlessly with the DataSharks End of Day Downloader, as well as their Real Time Downloader. Additionally it works with other data downloader's such as: DialData, CSI, Bridge - any 'end of day' data that is stored either in ASCII or MetaStock format. The ability to plot real time data (obtained by the DataSharks RT Downloader) is included in the Epsilon Charting application for no additional fee. The Epsilon EOD charting application is the only charting application that has the ability to read the FREE REAL TIME prices that are available on the Internet - we know of no other charting application, which will accomplish this! The charting application is very easy to use with the strength of a professional charting application serving as its foundation. We offer a free trial period of three weeks that will provide you ample enough time to prove to yourself how easy to use, agile, and powerful the charting application is. The program comes with detailed step by step instructions that will have you viewing charts like a seasoned pro in no time at all! As everyone knows viewing the data is only possible if the data has been saved on ones hard disk. You will be pleased to know that our charting application can read all of the more common data formats such as: ASCII (text), CSV (spreadsheet), CSI, CompuTrac/MetaStock format files, CRB Charts, TC 2000, Knight-Ridder Pro... |
|
| The 3D Charting Toolkit is a component bundle designed to help you to display 2D and 3D business, scientific and presentation charts. The package includes 3DChart, 3DPieChart, 3DClock, 3DLegend and 3DClock all sharing a set of common features. The main component is 3DChart. Following are the key feature of this powerful component:
..
|
|
| SharpShooter Dashboards is a pack of .NET components for complicated and intelligent digital dashboard creation. The package includes the component for hardware emulator creation and the component for interactive graphs and charts creation... |
|
| Stock charting and technical analysis trading system with a complete set of models and charting features, support for all instruments, Internet connectivity, spreadsheet-like capabilities, built-in database query builder and fully customisable charts..
|
|
| Parity Plus is one of the most powerful Stock Charting and Technical Analysis Programs available on the market. Parity includes over 50 of the most popular indicators for the technical analysis of stocks and commodities.. |
|
| Easy to use .NET gauge and charting controls for Windows Forms applications. The package includes Graph, Line, Area, Bar, Radar and Pie charts and Oval and Linear gauges. Each of them can be fully customized via the hundreds properties and methods... |
|
| Easy to use .NET gauge and charting controls for Windows Forms applications. The package includes Graph, Line, Area, Bar, Radar and Pie charts and Oval and Linear gauges. Each of them can be fully customized via the hundreds properties and methods... |
|
| ZoomChart - the interactive charting tool for your website
ZoomChart is a powerful Java applet for charting data on the internet. Simply integrate your data with our plug and play software for charting content in minutes. Plot unlimited lines of historical or real time data and customise the chart look and feel with simple html changes. Website users can select and deselect lines and zoom in and out of data interactively. Free eval download and unique online service providing free hosting of slimline ZoomChart edition... |
|
Related search : ata from,charting applicationreal timeepsilon charting,charting application thatcharting toolkit,sharpshooter dashboardscharting componentsgauges and,data from,technical analysisparity plusstock chartingcharting and,plus stock chartingparity plus stoOrder by Related
- New Release
- Rate
advanced charting -
excel charting -
nursing charting -
charting tool -
charting control -
|
|